Zenith Astronomy Toolkit

Welcome to Zenith, an engineering-focused astronomy toolkit.

Live API Demo

Tip: Click or press Enter or Space on any endpoint path below to instantly copy it to your clipboard.

Generated Artifacts

1. Telescope Performance (SNR)
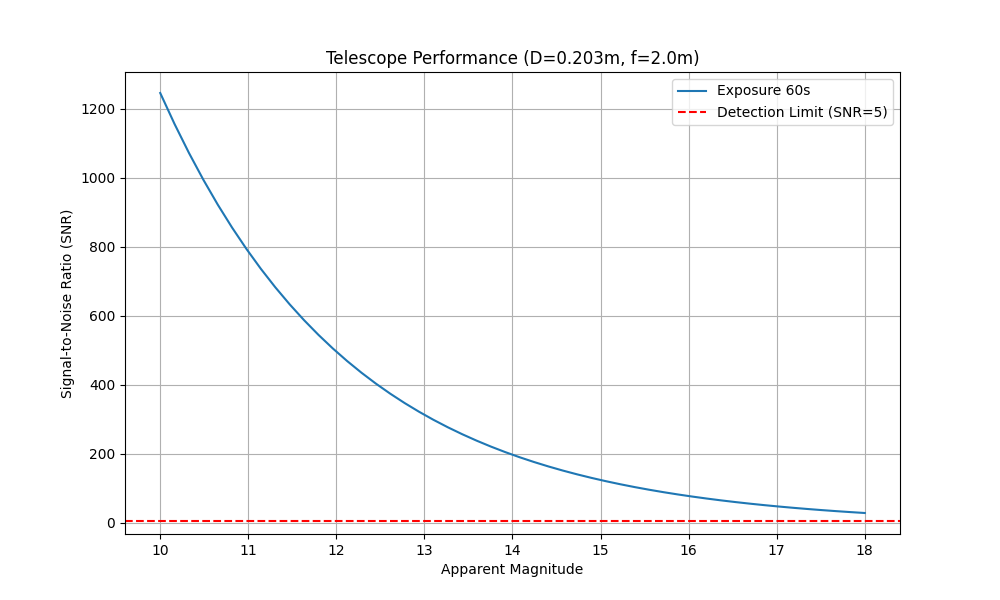
Line graph showing Signal-to-Noise Ratio versus Apparent Magnitude for an 8-inch telescope. The Signal-to-Noise Ratio curve decreases exponentially as magnitude increases, with a red dashed line indicating the detection limit at a Signal-to-Noise Ratio of 5.
Signal-to-Noise Ratio vs Magnitude for an 8-inch telescope.

2. Exoplanet Transit Light Curve

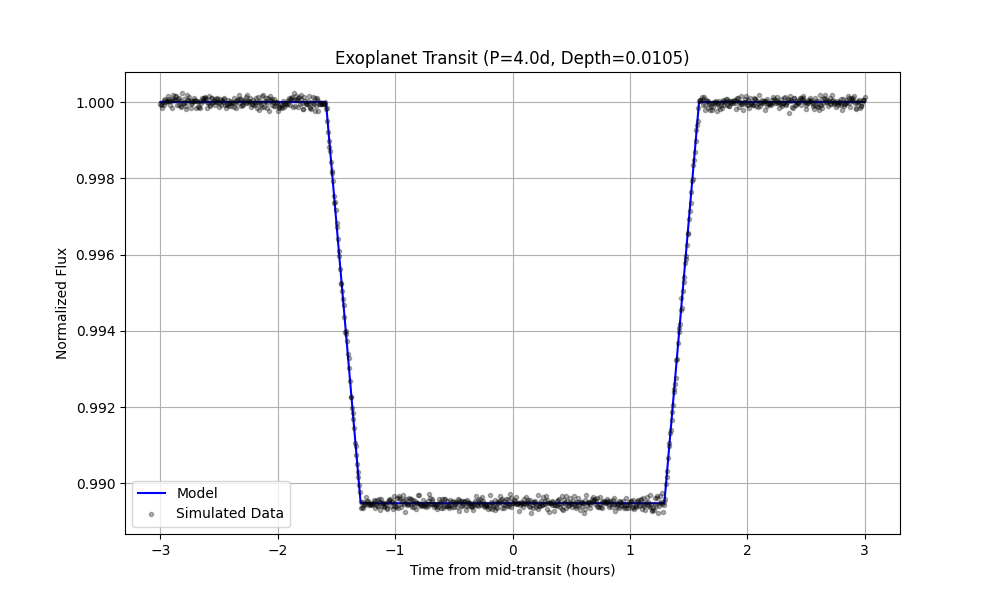
Graph showing a simulated exoplanet transit light curve with a normalized flux dip at 0 hours, representing a Hot Jupiter transiting a Sun-like star.
Simulated light curve of a Hot Jupiter transiting a Sun-like star.

3. Visibility Plot

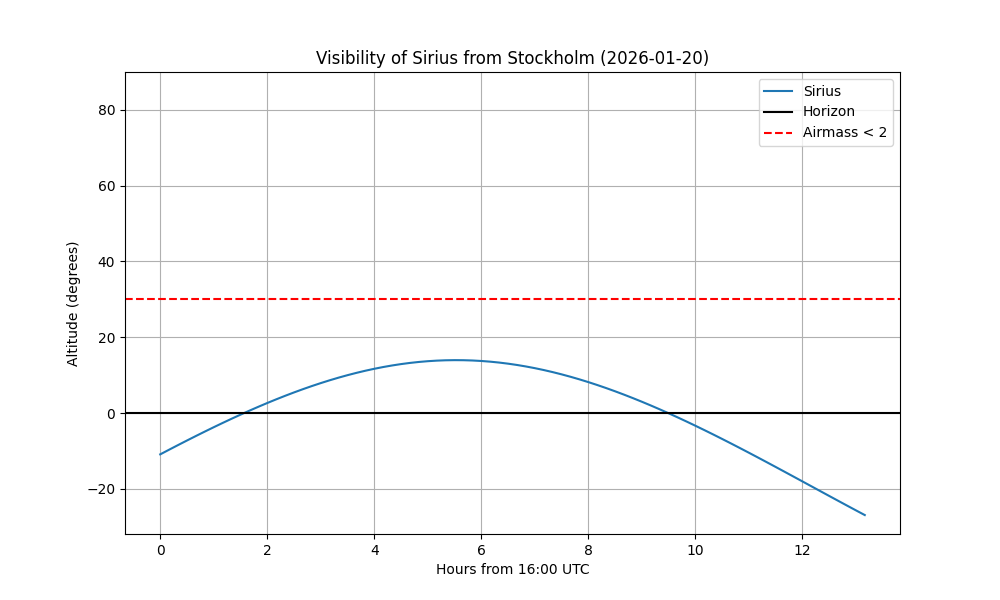
Line graph plotting the altitude of Sirius from Stockholm over time. The curve shows the star rising above the horizon, reaching a peak altitude of around 15 degrees, and setting, remaining below the airmass limit of 30 degrees.
Altitude of Sirius over time from Stockholm.